Assignment 4: The AI Divide in the GTA
A Data Scrollytelling Experience
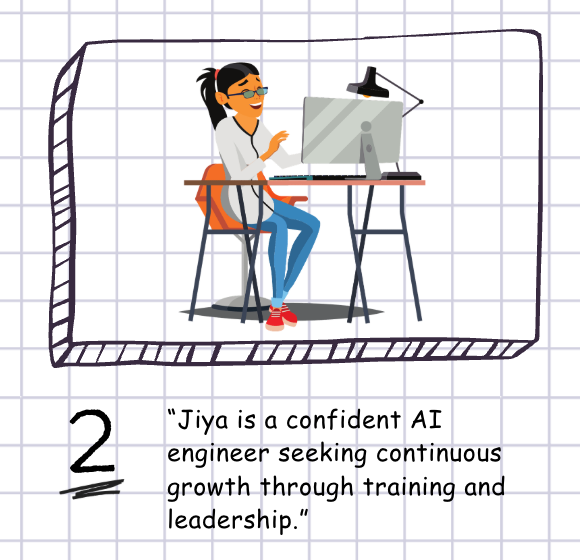
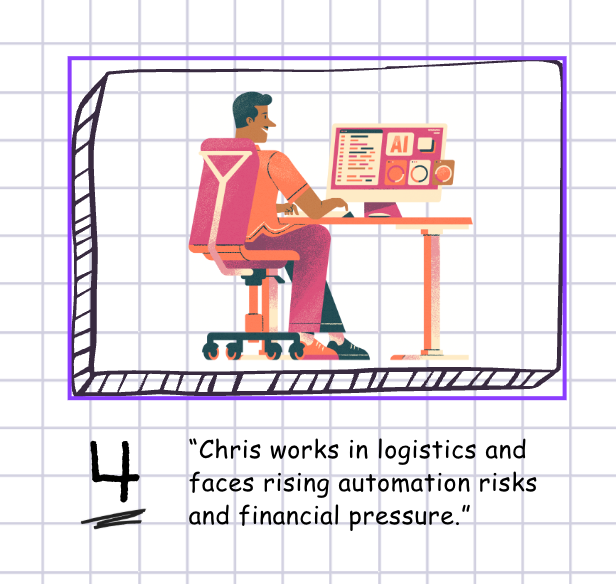
This project explores the growing economic divide created by AI adoption in the Greater Toronto Area. Through interactive visualizations and narrative storytelling, we follow two personas navigating the AI economy: Jiya Sharma, an AI engineer thriving in tech, and Chris Anderson, a logistics supervisor facing automation-driven job insecurity.
Key themes explored:
- Wage gap trends between AI/tech and traditional industries
- Education enrollment shifts toward AI and computer science
- AI exposure and complementarity across occupations
- Accessible training pathways for workers in at-risk sectors
- Geographic distribution of tech vs. business programs in Canada
Built with Streamlit, Plotly, Folium, and Pandas. Data sources include Statistics Canada, AI occupational exposure indices, and provincial enrollment records.
Meet the Personas

Jiya Sharma
Role: AI Engineer
Education: MSc in Computer Science
Situation: Secure career with growing opportunities in the AI sector. Benefits from high complementarity with AI tools.

Chris Anderson
Role: Logistics Supervisor
Education: Business Management
Situation: Facing job insecurity as automation replaces manual coordination. Exploring upskilling pathways to remain relevant.
Story Boards & Visualizations
The scrollytelling narrative is structured around key data insights visualized through interactive charts and maps:
Geographic distribution of AI/Tech vs Business enrollment across Canada
Tech vs Logistics: Wage gap over time
Education enrollment trends: Math/CS vs Business
AI complementarity vs exposure by occupation
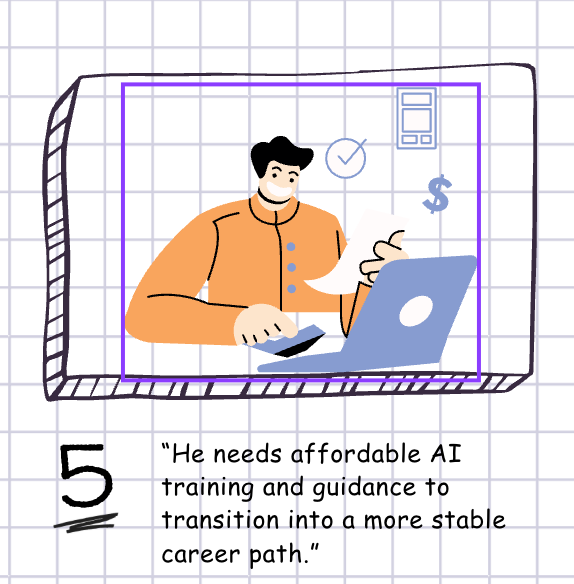
Upskilling pathways: Cost and duration comparison
Interactive Folium map: Provincial enrollment patterns
Scrollytelling Video Walkthrough
Watch the complete scrollytelling narrative in action: a guided tour through the AI divide story.
Click to load video